12.4 Operations Basics and Cost Optimization
Goal of this section: Build operational awareness, learn how to monitor application health, control costs, and avoid billing surprises.
Xiaoming's "Personal Douban" has been live for a week. Everything looked fine—until the old pro asked, "Do you know how many people are using it? How will you know if something goes wrong?"
Xiaoming froze. He only knew the site "opens," but as for how many visitors there were, whether there were errors, or whether the database connection was healthy—he had no idea.
Going live isn't the finish line—it's the starting point of operations. Your app is now running on the public internet 24/7, and someone needs to "keep an eye on" it.
Who keeps an eye on it after launch
For solo developers, "operations" sounds heavy, but it really comes down to three things:
- Know whether the app is healthy—Are people visiting? Are there errors?
- Be able to locate issues quickly—Where did it break? When did it start?
- Reduce risk when making changes—Test new features with a small group before full release
These three things don't require you to stare at a screen 24/7. The deployment platform already handles most of the work for you—you just need to know where to look.
Understanding your data
Deployment platforms usually provide an analytics dashboard to show your app's runtime status.
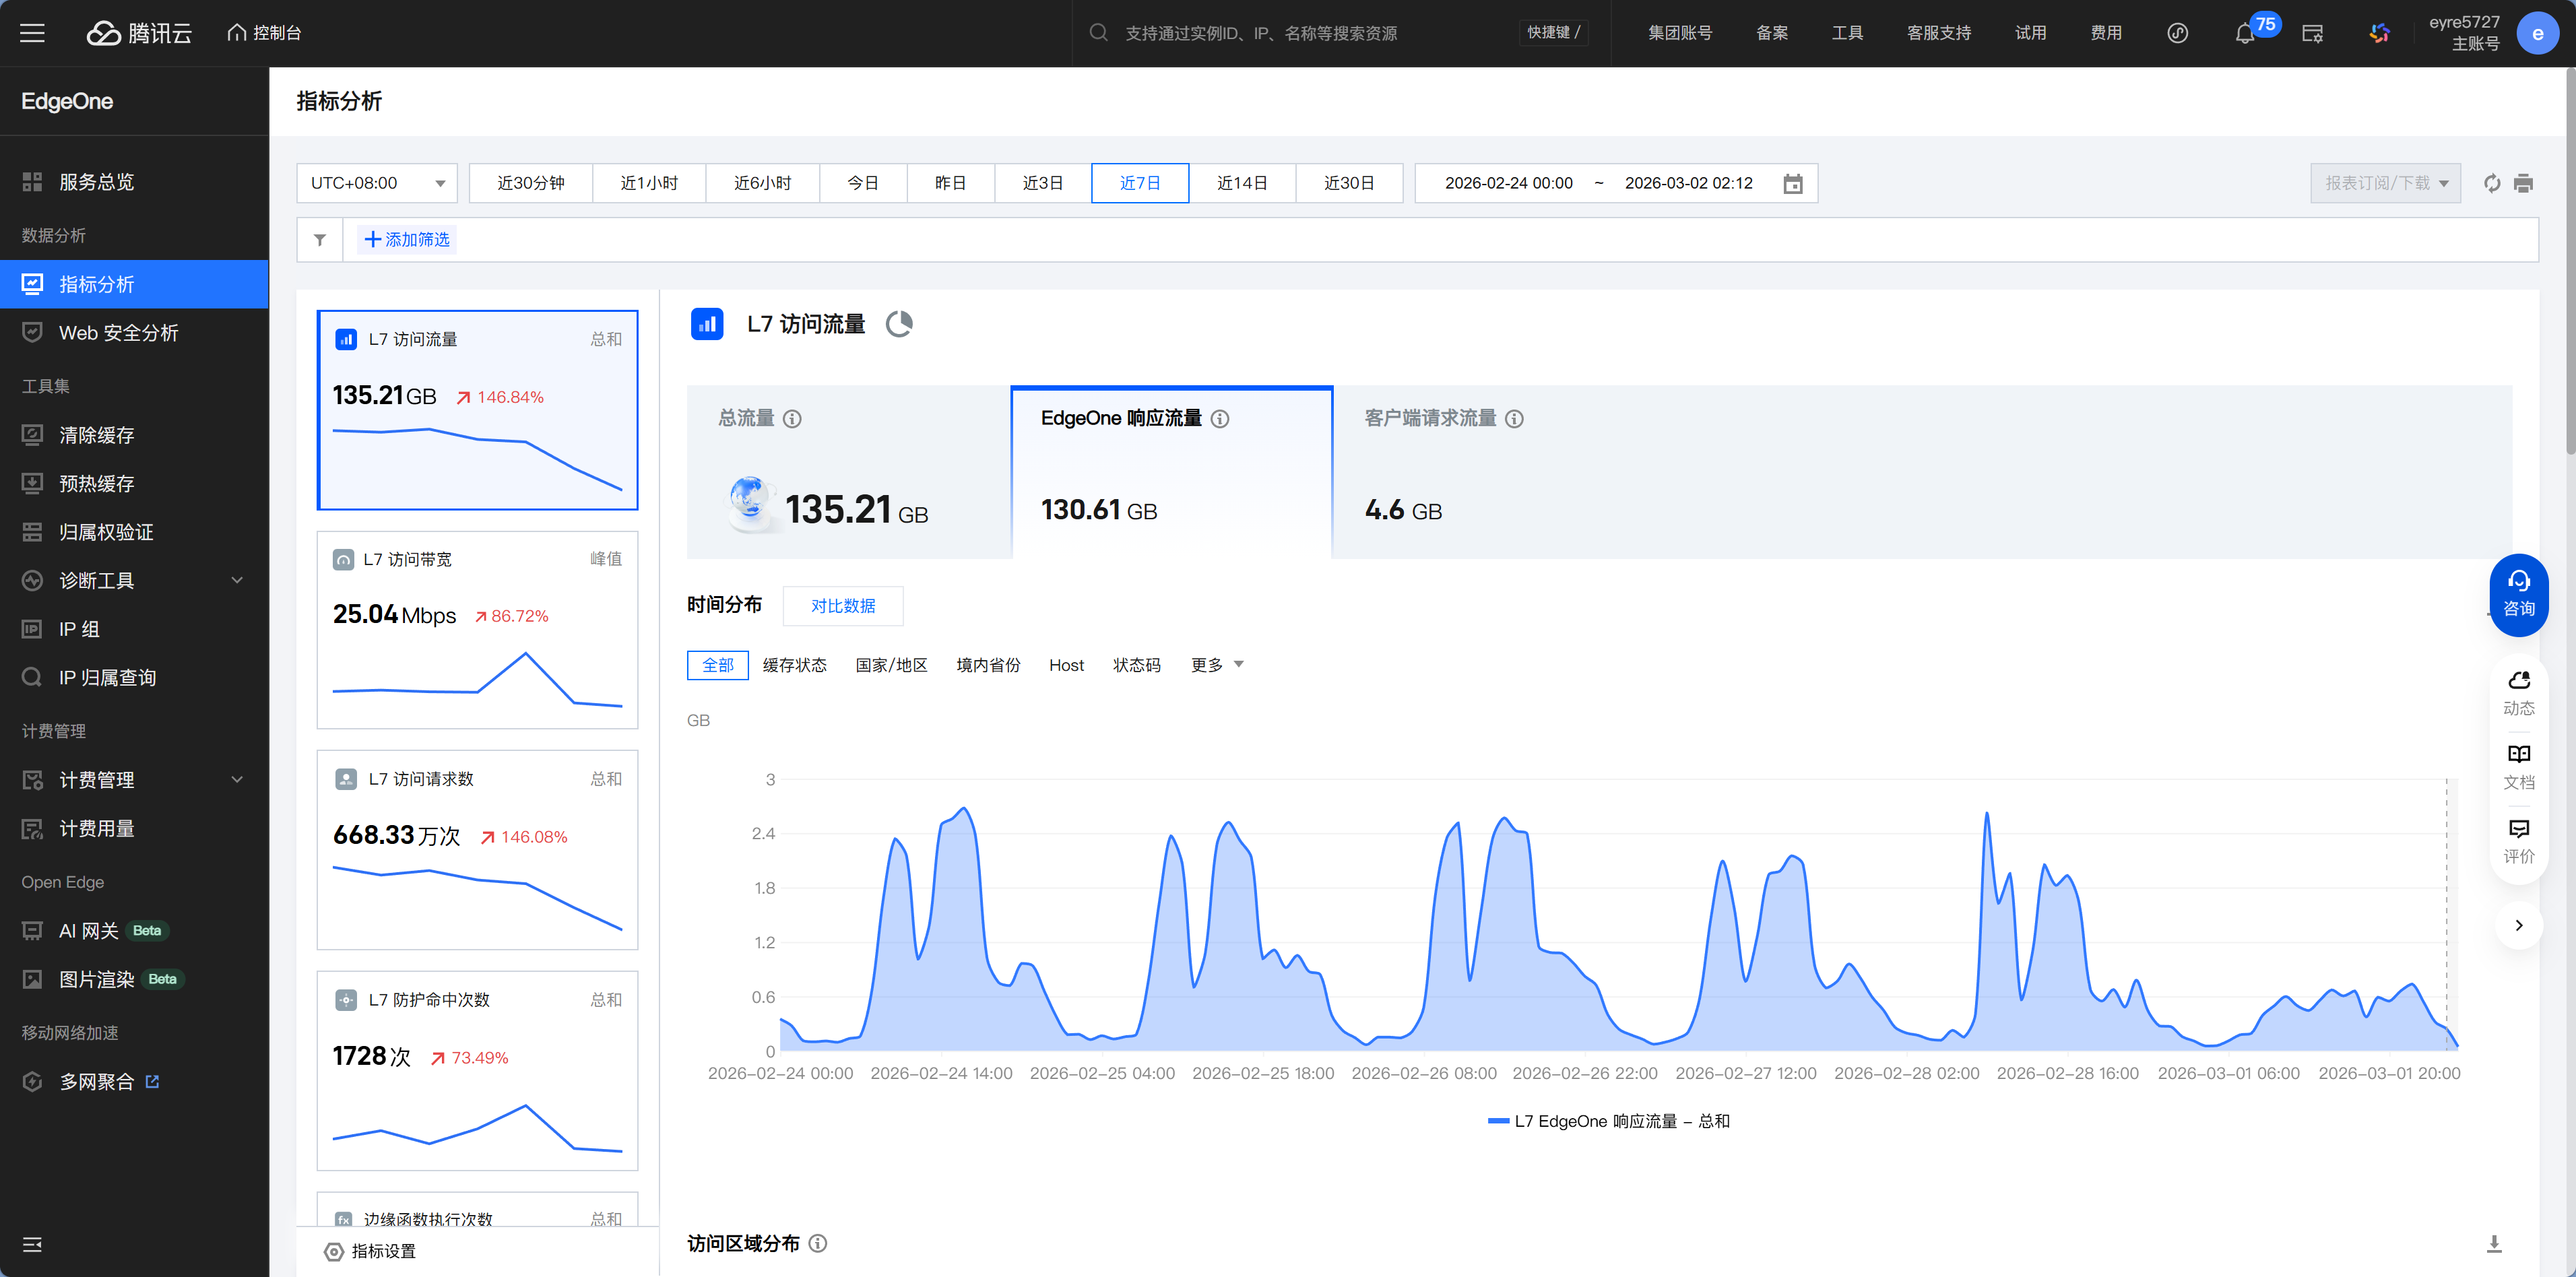
The location of the analytics dashboard varies by platform:
- EdgeOne: Console → Project → Data Analytics
- Vercel: Dashboard → Project → Analytics
- Cloudflare: Dashboard → Workers & Pages → Analytics
Logs: where to look when something goes wrong
One day, Xiaoming got a message from a friend: "Your website won't load—it just keeps spinning." Xiaoming tried it himself, and sure enough, it was very slow.
This is when you need to check the logs. Logs are like a dashcam—when there's an accident, replaying them tells you what happened.
Xiaoming opened EdgeOne's deployment logs and found this line:
Error: Connection timed out - database not respondingThe cause was clear: the database connection had timed out. Xiaoming checked the Neon console and saw that the free-tier database had been suspended due to long inactivity. After reactivating it, the site returned to normal.
The basic log-troubleshooting workflow is simple:
- First check whether there are any red ERROR messages
- Find the context around the time the error occurred
- If you can't make sense of it, copy the key details and give them to Claude Code for analysis
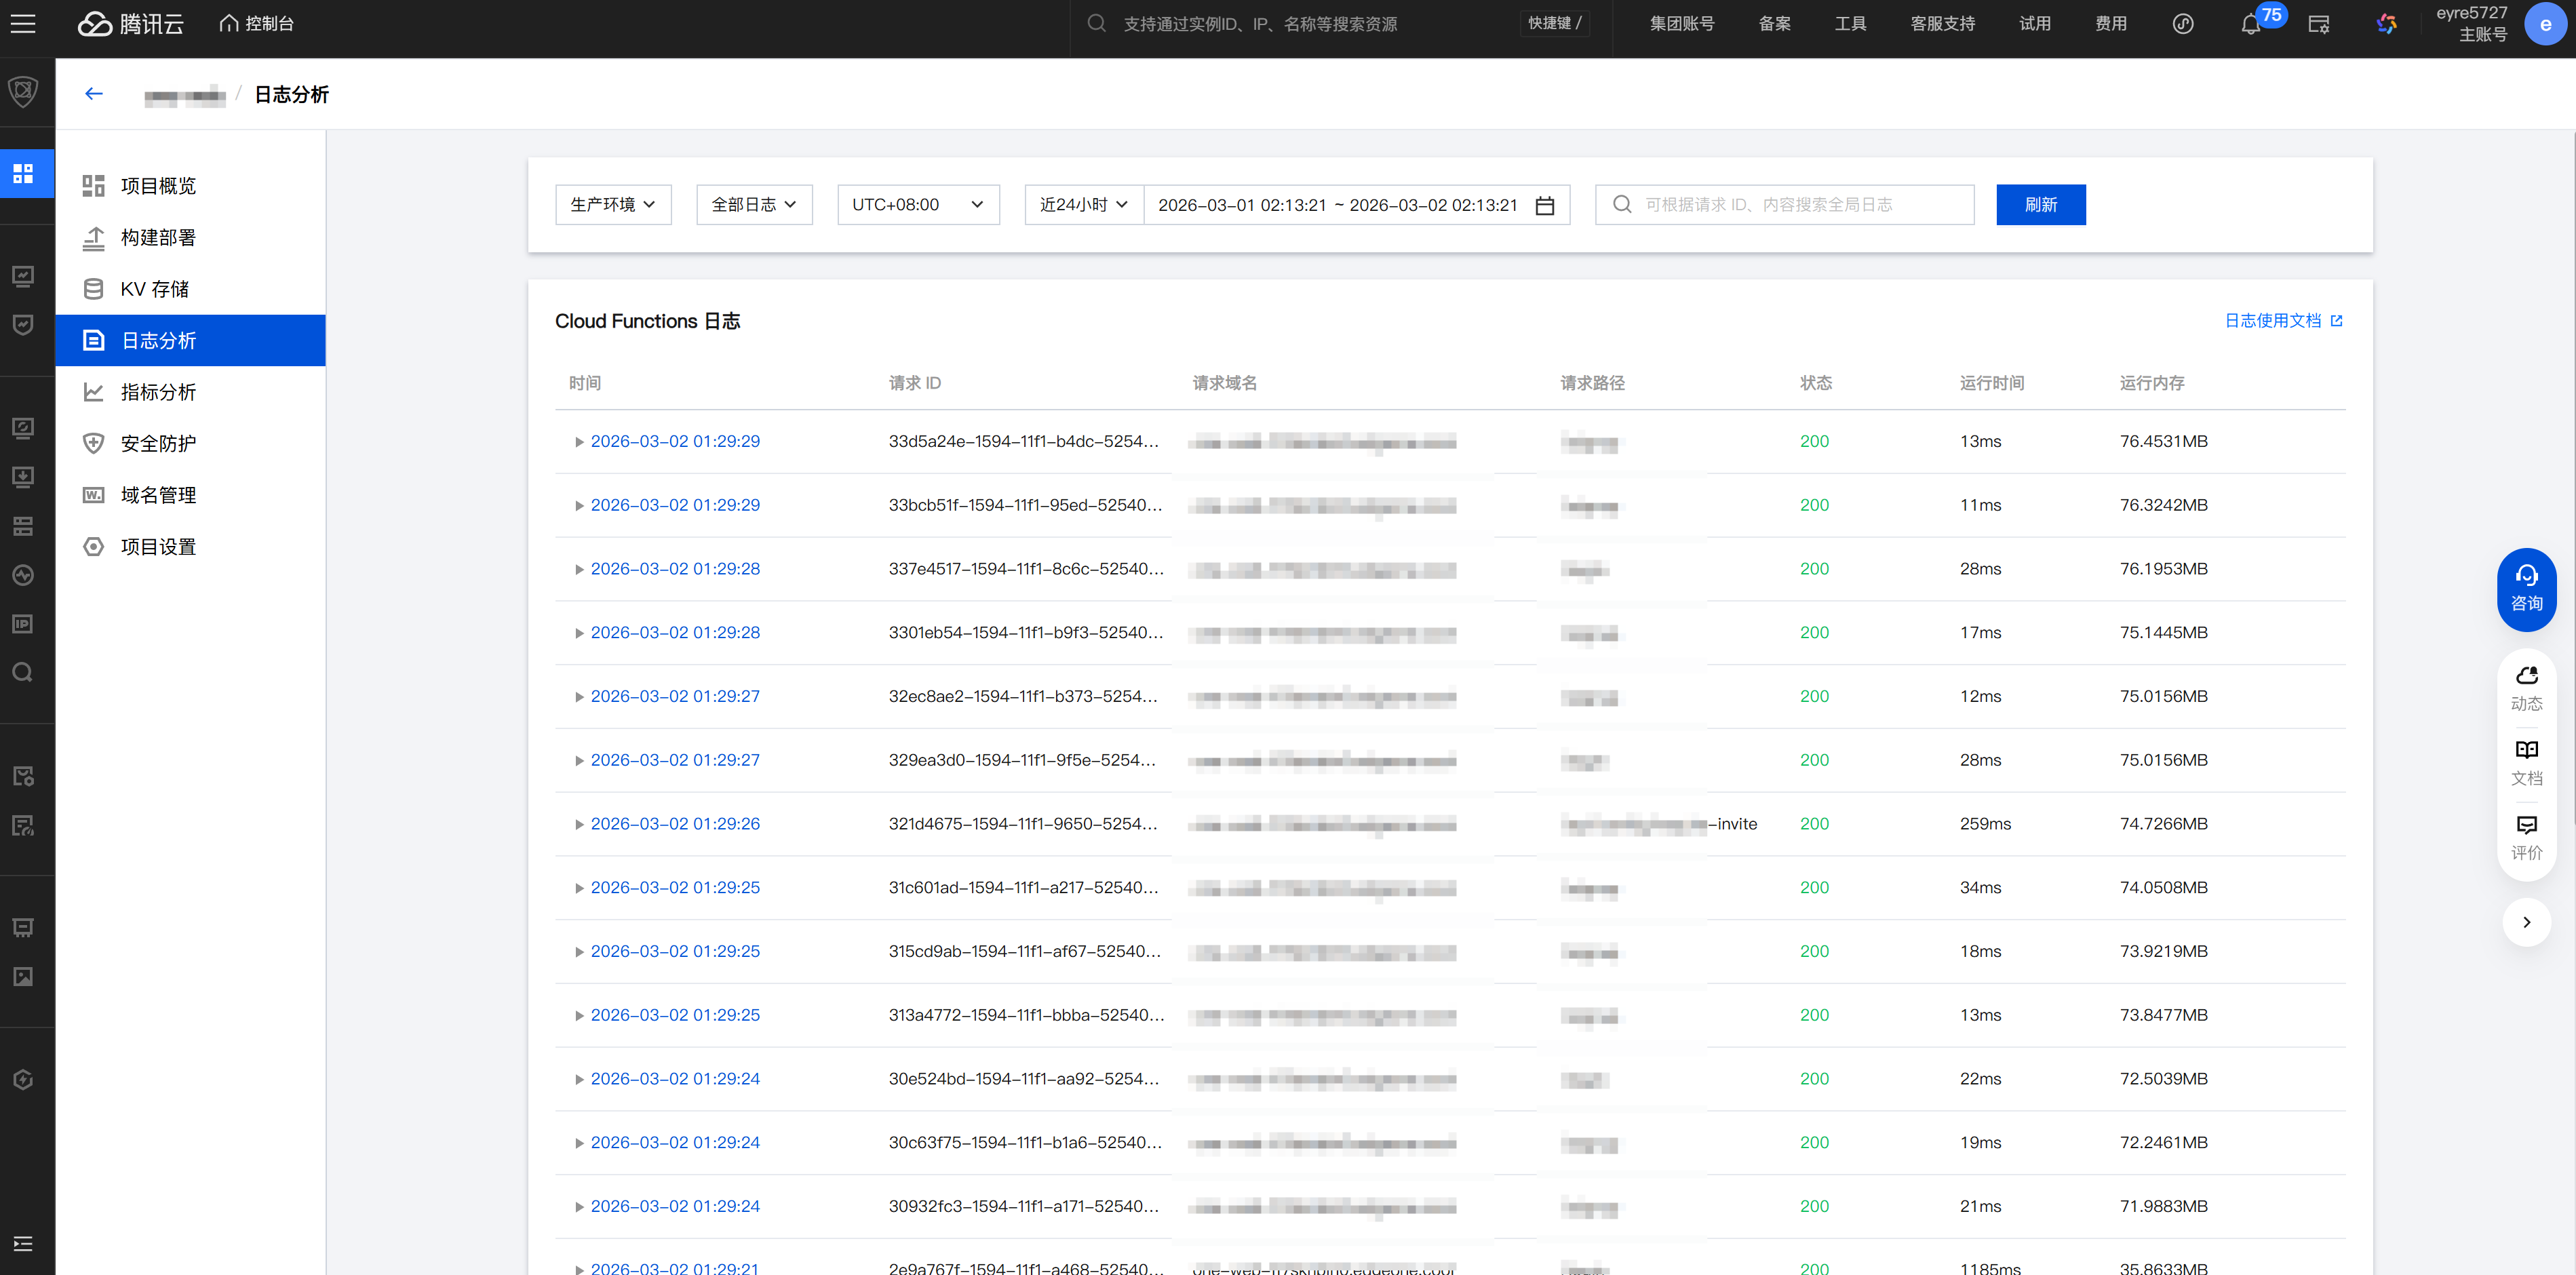
How to view logs on each platform:
- EdgeOne: Console → Project → Deployment Logs + Runtime Logs
- Vercel: Dashboard → Project → Logs, with filtering by time and keywords
- Cloudflare: Dashboard → Workers & Pages → Real-time Logs
Optimizations the platform already handles for you
Serverless platforms do a lot by default, so you don't have to worry about them:
Auto scaling—Like your phone's automatic brightness adjustment: it dims when the light is strong and brightens when it's dark, without you needing to move the slider manually. With traditional servers, you have to guess in advance, "How many servers does my website need?" Guess too low and it can't handle the traffic; guess too high and you're wasting money. Serverless platforms automatically adjust resources based on actual traffic, so you don't need to think about it at all.
Global CDN—Static assets (HTML, CSS, JS, images) are automatically distributed to global edge nodes. When users visit, the CDN returns content from the node closest to them instead of hitting the origin server every time.
Image optimization—Automatically compresses images and converts them to more efficient formats (WebP/AVIF). You might upload a 2MB PNG, but users may only download 200KB.
HTTPS—Automatically applies for and renews SSL certificates. You don't need to configure HTTPS manually—the platform gives you secure connections by default.
On traditional servers, these optimizations would require you to configure Nginx, Let's Encrypt, CDN services, and more yourself... now the platform handles all of it.
Optimizations you can focus on
When users say the site feels "slow," you can ask Claude Code to help check:
"Analyze my website performance and give me optimization suggestions"
Common optimization directions:
Images are too large—The initial page load is slow. Use the next/image component, which automatically serves appropriately sized images based on the device dimensions.
API is too slow—The blank-screen time is too long. Check whether database queries are missing indexes or whether there is an N+1 query issue. Both were mentioned in the database section of Chapter 6.
Bundle size is too large—JS files are too big, so download times are long. Check whether you imported unnecessary libraries. Tell Claude Code: "Analyze my bundle size and find the largest dependencies."
No caching—The same data is requested repeatedly. Add appropriate caching strategies so browsers and the CDN can cache content that doesn't change often.
Cost: is the free quota enough
Xiaoming is using only free plans right now and hasn't spent a cent. But the old pro reminded him: "Free quotas are for trying things out, not for running production long-term. You need to know when you'll start getting charged."
Phased decision-making
The old pro kept emphasizing: don't worry about phase-three problems while you're still in phase one.
MVP stage (< 1,000 users)——Use the free Serverless tier, with a monthly cost of ¥0. At this stage, the priority is validating the product, not optimizing costs.
Growth stage (1,000 - 10,000 users)——The free quota may no longer be enough, and you'll need to upgrade to a paid plan. Monthly costs are roughly ¥50-200, depending on traffic and feature usage. This is when you start paying attention to cost trends.
Scaled stage (> 10,000 users)——Evaluate whether to continue using managed services or build your own infrastructure. Decisions at this stage depend on the specific business and are outside the scope of this chapter.
Free quotas
Vercel's free tier limits each request to a maximum of 10 seconds. The API Routes you write in Next.js (such as /api/books) become Serverless Functions after deployment to Vercel. For most APIs, 10 seconds is more than enough, but if your API needs to query a large amount of data or call an external AI API, 10 seconds may not be enough. After a timeout, users will see a blank page and a "504 Gateway Timeout" error—which means "the server took too long to process the request and gave up." The solution is to optimize API performance or upgrade to the Pro plan (which increases execution time to 60 seconds).
Neon's free tier has limited compute time, and databases that stay inactive for too long will be suspended. On the next access, they need a "cold start," so the first request may be 1-2 seconds slower. This was one of the reasons behind the "site won't open" issue Xiaoming encountered earlier.
Supabase's free tier allows only 2 projects, and it pauses projects that are inactive for 7 days. If you have multiple projects running, the free tier becomes insufficient very quickly.
AI model costs
If your application calls AI APIs (such as OpenAI, Claude, or GLM), model costs may be your biggest expense. The old pro recommends setting daily or monthly spending caps on the API platform to prevent sky-high bills caused by code bugs (such as an infinite loop repeatedly calling the API).
Lightweight canary releases
The preface mentioned the concept of canary releases—first push a new version to a subset of users, then do a full rollout after confirming everything is fine.
For personal projects, you don't need a complex canary system. Preview link → Test → Merge is the simplest canary workflow:
- Develop the new feature on a feature branch
- Create a PR, and the platform automatically generates a preview link
- You and your friends test on the preview link
- Once everything checks out, merge the PR into
main, and it will automatically deploy to production
This workflow was already covered in 12.3. It's not a strict canary release in the formal sense, but it's more than enough for personal projects—at least someone has tested the new feature before it goes live.
Chapter Summary
You now know the full workflow from deployment to operations: choosing a platform → configuring deployment → automated CI/CD → monitoring and optimization. Next, in Chapter 13, you'll connect your own domain to the app to make it look more professional.