15.3 Umami Analytics
Launching isn't the end—it's the beginning of understanding. Data tells you "what happened," while user feedback tells you "why it happened."
Xiaoming Sees the Data
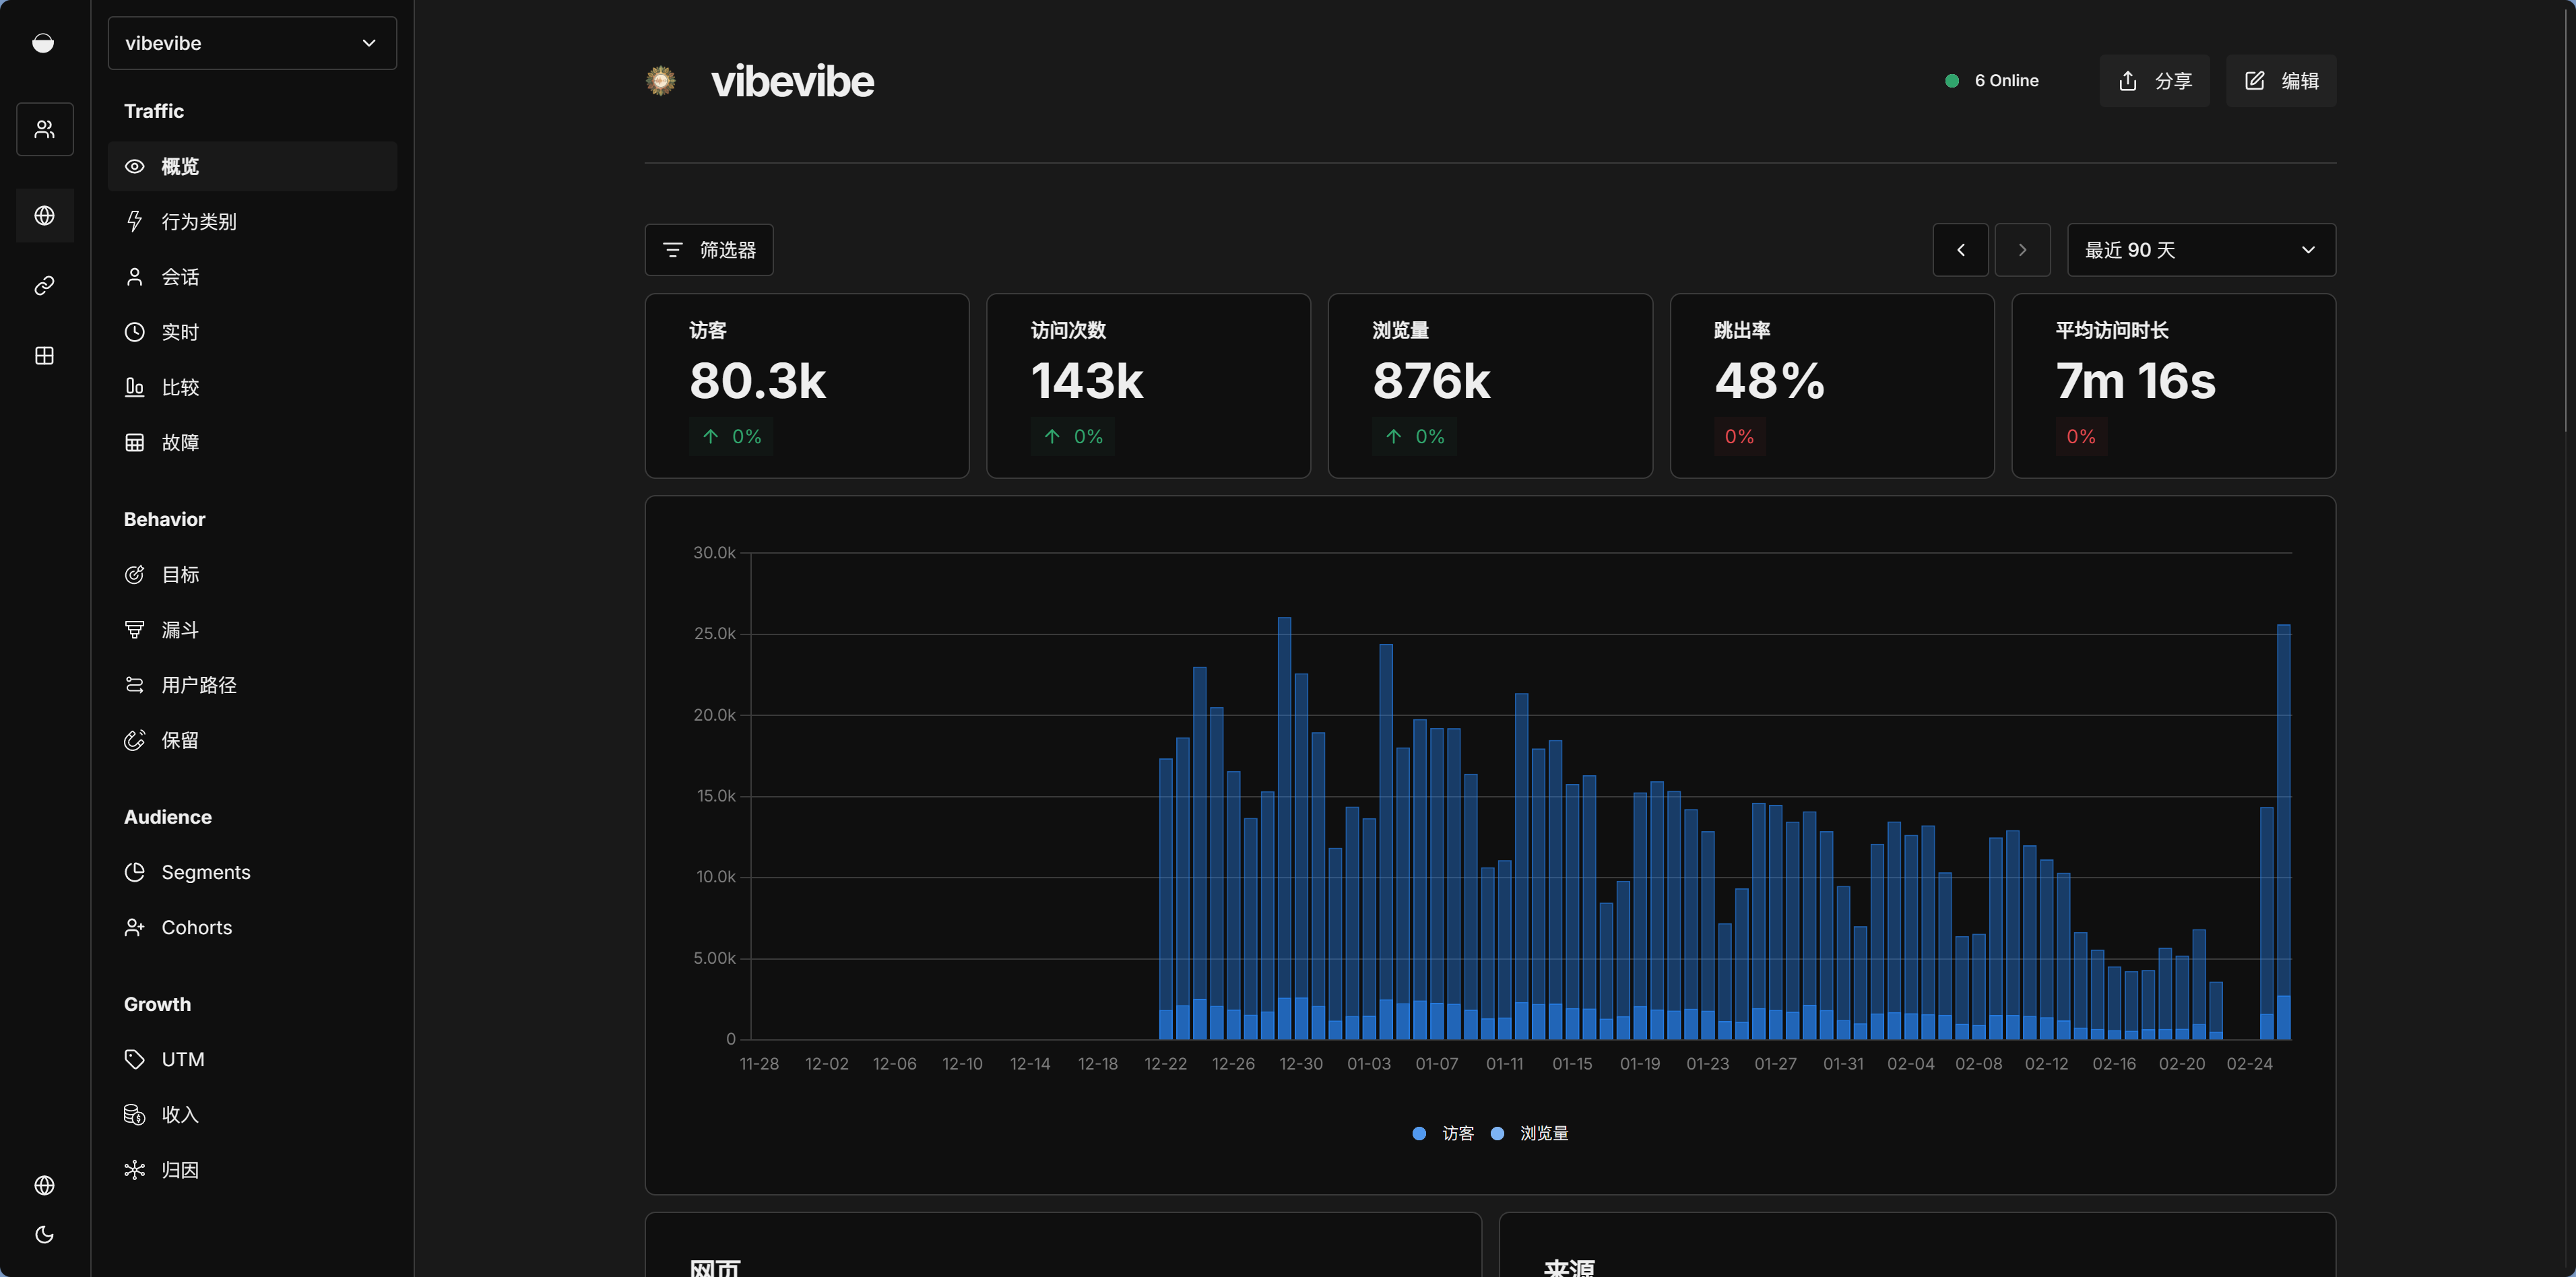
Xiaoming opens the Umami dashboard he installed in Chapter 14 and sees the numbers start moving—pageviews, unique visitors, traffic sources...
"So people really are using my website!"
This feels completely different from writing code. When you're coding, you're facing an editor and a terminal; but when you see real traffic data, you suddenly realize there are real people on the other side of the screen using what you built. Xiaoming stares at the dashboard for quite a while, watching the "current visitors" number jump from 0 to 1, then from 1 to 2. It's more exciting than any console.log.
But after the excitement wears off, he realizes he doesn't know what these numbers actually mean. "I got 47 pageviews today—is that a lot or a little?" "A 68% bounce rate—is that good or bad?" "Social makes up 80% of my traffic sources—what does that tell me?"
The seasoned mentor says, "Data by itself doesn't mean anything. What matters is how you interpret it."
Why You Need Website Analytics
Before you have data, everything you know about your users is just a guess. You think your homepage looks good, but you don't know whether users actually spend time on it; you think a certain feature is useful, but you don't know whether anyone is really using it.
Website analytics answers the most basic questions in product operations:
| Question | Analytics Data |
|---|---|
| How many people are visiting? | Pageviews (PV), Unique Visitors (UV) |
| Where are they coming from? | Referring sites, search keywords, social platforms |
| What devices are they using? | Device type, operating system, browser |
| Which pages are popular? | Page ranking by views |
| How long do users stay? | Session duration, bounce rate |
This data isn't for "showing off" ("My website got 1000 PV today!"), it's for making decisions. For example:
- If 80% of your users visit on mobile, but your mobile experience is poor—you know what to prioritize
- If a certain page has an especially high bounce rate—it means users leave as soon as they arrive, and the content may not be meeting their expectations
- If most of your traffic comes from social sharing rather than search engines—it means SEO still needs time, but your OG configuration (15.1) is definitely working
Without data, all you can do is guess. With data, you can make informed decisions.
Why Choose Umami
There are many website analytics tools on the market, and the most well-known one is Google Analytics (GA). But for indie developers, Umami is the better choice.
| Comparison | Umami | Google Analytics |
|---|---|---|
| Deployment | Self-hosted, data stays on your own server | Cloud service, data lives on Google's servers |
| Privacy | No cookies, no personal tracking | Detailed user tracking, requires cookie consent banners |
| Script size | < 1KB, almost no impact on page load | ~45KB, with a noticeable performance impact |
| Interface | Clean and intuitive, easy to understand at a glance | Powerful but complex, with a steep learning curve |
| Data ownership | Fully yours | Owned by Google |
| Cost | Free if self-hosted | Free version has limits, advanced versions cost money |
Umami's philosophy is "just enough." It won't tell you users' age, gender, or interests (GA can), but it will tell you the things that matter most: how many people came, where they came from, what they viewed, and what devices they used. For personal projects and small products, that's already enough to guide your decisions.
And because Umami doesn't use cookies, you don't need to put that annoying "This site uses cookies, please consent" popup on your website. That's a very real win for user experience.
Quick Start
In Chapter 14, you already installed Umami through the 1Panel app store. If you haven't installed it yet, go back to 14.5 Useful Applications and follow the steps there.
First Login
Umami's default login credentials are:
- Username:
admin - Password:
umami
The first thing you should do after logging in: change the password. This default password is known worldwide. If you don't change it, you're basically leaving your analytics dashboard open to the public.
Add Your Website and Integrate the Tracking Code
After logging in, go to Settings → Websites, click "Add website," and enter your website name and domain. After saving, Umami will generate a tracking snippet:
<script defer src="https://your-umami-url/script.js" data-website-id="your-website-id"></script>Add this snippet to your website's global layout file. In a Next.js project, put it inside the <head> of layout.tsx; in a VitePress project, add it to the head array in the config file. After redeploying, Umami will start collecting data.
Xiaoming adds the tracking code, redeploys, and then visits his own site a few times. When he goes back to the Umami dashboard—the data is already moving. Even though it's all his own visits, it's still satisfying to see the system really working.
The Seasoned Mentor Teaches Xiaoming How to Read Metrics
After the data starts accumulating, Xiaoming checks the Umami dashboard every day. But he realizes he's only "looking at numbers" without really understanding what those numbers are saying.
The seasoned mentor sits down and explains them one by one.
点击指标卡片查看详情
Traffic Metrics: The Four Most Basic Numbers
| Metric | Description |
|---|---|
| Pageviews | The total number of times pages were viewed. If one user views 3 pages, that's 3 PV |
| Unique Visitors | How many different people visited your site. If the same person refreshes 10 times, it still counts as 1 UV |
| Visits | The number of sessions. If one user comes once in the morning and once in the afternoon, that counts as 2 Visits |
| Bounce Rate | The percentage of visitors who leave after viewing only one page |
These four numbers together can tell you a lot. For example:
- High PV but low UV: A small group of users is visiting repeatedly—you have a loyal audience
- High UV but low PV/UV ratio: Lots of people came, but only viewed one page before leaving—the content may not be compelling enough
- High bounce rate: Not necessarily a bad thing—if your site is a single-page app or a blog, it's normal for users to leave after reading one article. But if it's an e-commerce site, a high bounce rate deserves attention
Traffic Sources: Where Your Users Come From
| Source | Description |
|---|---|
| Search | Traffic from search engines—this is the result of 15.2 SEO |
| Social | Traffic from social media—this is the result of 15.1 OG sharing |
| Direct | Direct visits—users typed in the URL manually or clicked from bookmarks |
| Referral | Traffic from links on other websites |
The distribution of traffic sources helps you judge which channels are most effective. Xiaoming looks at his own data and finds that most of his traffic comes from Social—looks like the OG cards he configured in 15.1 really are working, and links shared by friends brought in quite a few clicks. But Search traffic is still low, which is totally normal—SEO takes a few months to show results.
If you find that Direct traffic makes up a high percentage, it means some users already remember your website address, which is a good sign. If Referral traffic suddenly spikes, go check which site linked to you—maybe someone recommended your product in a blog post.
Device Information: What Users Are Visiting With
| Metric | Description |
|---|---|
| Browser | Chrome, Safari, Firefox... which browser is used the most |
| OS | Windows, macOS, iOS, Android... |
| Device | Desktop, mobile, tablet |
Device data directly affects your development priorities. If 70% of your users visit on mobile, then you should prioritize improving the mobile experience. If most users are on Chrome, you can feel more confident using some newer Web APIs.
Key Metrics vs. Vanity Metrics
After collecting data for a while, Xiaoming excitedly tells the seasoned mentor, "My website got 5000 PV this month!"
The seasoned mentor doesn't look as impressed as expected. Instead, he asks, "So what? What are you going to do with that?"
Xiaoming freezes.
"That's the problem with vanity metrics," the seasoned mentor says. "The numbers look nice, but they don't guide your next move."
| Key Metrics (Actionable) | Vanity Metrics (Looks good but not useful) |
|---|---|
| Retention rate—do users come back | Total pageviews—bigger doesn't always mean better |
| Conversion rate—do users sign up/buy | Total visitors—showing up doesn't mean staying |
| Active users—how many are actually using it | Time on page—they may have just forgotten to close the tab |
The rule of thumb is simple: after seeing a metric, do you know what to do next?
- "Total pageviews increased by 20%" → So what? You don't know what action to take. (vanity metric)
- "Signup conversion rate dropped from 5% to 2%" → Check whether something broke in the signup flow. What changed recently? (actionable metric)
- "Homepage bounce rate rose from 30% to 60%" → The homepage content may need adjustment, or the quality of incoming traffic may be lower. (actionable metric)
Xiaoming starts to understand: the value of data isn't in the numbers themselves, but in whether it helps you make better decisions.
Event Tracking: Beyond Pageviews
Besides automatically collected pageview data, Umami also supports custom event tracking. For example, maybe you want to know how many people clicked the "Sign Up" button, how many downloaded your PDF, or how many clicked the share button.
There are two ways to implement it:
- Add the
data-umami-event="event-name"attribute to an HTML element—the simplest option, no JS required - Use the
window.umami.track('event-name', { property: 'value' })API—more flexible, and you can attach extra information
If you need to track certain events, just tell Claude Code. But the seasoned mentor reminds Xiaoming: don't track everything. Only track events that help you make decisions—like the key steps in your core conversion funnel. If you track too much, you'll just drown in data and lose sight of what matters.
Data-Driven Decisions: What to Do After Seeing the Data
Collecting data is only the first step. What's more important is using data to guide action.
After collecting a month's worth of data, Xiaoming notices a few interesting patterns:
- 65% of his users are on mobile, but he had been developing and testing mostly on desktop, so some mobile interactions actually weren't very good
- The "About" page has a bounce rate as high as 90%—users leave after reading it and don't continue to browse other pages
- Traffic on Wednesdays and Thursdays is noticeably higher than on other days—possibly related to when he posts on social media
These insights turn directly into actions:
- Prioritize fixing mobile interaction issues
- Add links to other pages at the bottom of the "About" page to guide users deeper into the site
- Move social media posting to Wednesdays and Thursdays, and put in more effort when the results are best
That's the value of data-driven decision-making. It's not about staring at numbers—it's about finding problems, validating assumptions, and guiding action.
Privacy Protection: Umami's Core Advantage
While collecting user data, privacy protection is a topic you can't ignore.
Umami was designed with privacy at its core from the very beginning:
- No cookies—so you don't need that annoying cookie consent popup
- No personal user identity tracking—Umami doesn't know "Zhang San visited 3 times today"; it only knows "there were X unique visitors today"
- No collection of personally identifiable data—it doesn't record IP addresses (or only stores hashed versions), and it doesn't store the full user-agent string
- All data is stored entirely on your own server—nothing is sent to any third party
This means Umami naturally complies with most GDPR (EU data protection law) requirements. You don't need to show a cookie banner on your site, and you don't need users to "consent to being tracked," because you aren't tracking individuals in the first place.
But that doesn't mean you can ignore privacy compliance entirely. If your website also collects other user data—such as email addresses during signup or information submitted through forms—you still need a privacy policy explaining how that data is used. That's what the next section is about.
Frequently Asked Questions
Q1: Can Umami and Google Analytics be used together?
Technically yes, but for personal projects it's unnecessary. Umami already covers the core needs. Adding another analytics script increases page load overhead (GA's script is about ~45KB), and you'll also have to deal with cookie consent popups. Unless you have very specific needs that Umami can't handle (such as e-commerce conversion funnel analysis), Umami alone is enough.
Xiaoming's Data Habit
Xiaoming has now built a habit: every Monday morning, he opens the Umami dashboard and spends 10 minutes reviewing the previous week's data. He's not checking whether the numbers went up or down—he looks with specific questions in mind:
- Did the changes I made last week affect user behavior?
- Are there any unusual data fluctuations?
- Has the distribution of traffic sources changed?
There isn't a lot of data, but every single piece helps him better understand his product. He's starting to feel that building a product isn't just about writing code—understanding users and using data to validate assumptions matter just as much.
But just as Xiaoming is getting absorbed in the world of data, the seasoned mentor suddenly turns serious: "You're collecting user data—do you have a privacy policy?"